National Stop on Red Week

redlight cam pictureThe Federal Highway Safety Administration (FHWA) has selected the first week of August as “National Stop on Red Week”  This week is devoted to increasing public awareness of the dangers of red-light running through both education and enforcement activities.

This is an important tie-in to the start of the school season as well — children will be walking to school, along rural roads to bus pick up locations and crossing streets at intersections.  It is especially critical to reduce the frequency of red-light running to minimize collisions with pedestrians — especially school children.

To be as effective as possible, the FHWA encourages local communities to do their part in promoting this cause.  They’ve suggested ten specific ways to boost awareness of the issue that range from holding press conferences to setting up targeted enforcement areas.

The suggestion for employers to issue paycheck reminders (i.e. targeted messages to employees and their families) begs the larger question of how employers routinely educate their drivers (and office bound commuters, sales drivers, etc.) to obey traffic laws, signs and signals.

In the past, SafetyFirst has published Ten-Minute Training Topics on the dangers of red light running, and one of our very first Videos / Online training modules ever produced dealt with this issue, too.

FHWA provides additional information at this web site – http://safety.fhwa.dot.gov/intersection/redlight/

The Insurance Institute for Highway Safety also has a page dedicated to red light running – http://www.iihs.org/iihs/topics/t/red-light-running/qanda#red-light-running

The Traffic Safety Coalition has produced a video to promote “National Stop on Red Week”:

Here are some more stunning videos of the aftermath of red light running:

Bridging the Gap for Stronger, Consistent Results

I’ve read a LOT of “Driver Safety” or “Fleet Safety” articles over the course of my 27 year career. They all look the same, they all cover the “basics” or “essentials” in the same way.

And many of them miss the mark in the same way.

You see, they’re not bad articles and the tips are meaningful, but instead fall short in one key area: managing the performance of your fleet drivers on a day to day basis.

The articles typically follow the same outline (highlighting import and valuable steps in the process):

  1. Discuss the need fortop management supportfor the fleet safety program 
  2. Stress the need to have a written, enforced policy statement or handbook  
  3. Plead with the reader about recruiting properly, qualifying prospective hires thoroughly and thoughtfully – following any/all applicable regulations, checking MVRs against a standard criteria
  4. Emphasize the need to “train-train-train” the drivers (before they drive, as they drive and after they crash). 

Then, alarmingly, these authors jump to the end of the story and tell you how:

  1. Incentives may influence drivers to pay more attention to their driving
  2. Drivers need to report crashes,
  3. Supervisors need to investigate the incidents with great attention to detail
  4. Management teams ought to calculate their incident rates and benchmark against peers to see if they’re trending up or down.

Looking at this visually, this is the picture I see in my mind:

Banner Typical safety programMy concern is filling or bridging that gap between thorough qualification and orientation/training processes and calculating results or offering incentives.

There’s a huge gap between the initial approach and the off ramp in that visualization.
In between initial hire and final exit interview should be many years of productive activity; therefore, finding ways to actively manage a group relationship with the cadre of drivers during their tenure as a productive employees becomes critical to leveraging consistent results.

The question may be “so how do I do that?” It can be a huge challenge, especially when we recognize that the drivers are largely away from the office for most of their working day. Further, many technological monitoring tools are both expensive (when you multiply the per vehicle per month cost across a larger fleet of vehicles) and burdensome (separating the “urgently actionable” conclusions from the “background noise” of excessive data).

What’s available in the toolbox to monitor and manage driver relationships, combat safety complacency, and promote proper vigilance or awareness on a daily basis?

  1. Driver Communications Plans: Two-Way communication with drivers through posters, postcards, payroll stuffers, tailgate talks, surveys, polls, small group discussions, newsletters, tailored reminder training, targeted refresher training, etc. (see also – “Driver Communication Plans Part One“, “Driver Communication Plans Part Two“, “Motivating Drivers to Make Safer Choices“; “Holding onto the Best Drivers“; “Driver Incentives“)
  2. Driver observations: ride alongs; commentary drives, drive-behinds, how’s my driving alerts (run stop signs, run red lights, improper weaving/passing, etc.), camera-in-cab recordings (hitting things).
  3. Technology: EOBR, GPS, TeleMatics, ELDs for reporting on vehicle activity such as harsh braking, hard acceleration, swerving, speeding. See also “The Vulnerability of Telematics as a Stand Alone Safety Solution
  4. Periodic or targeted MVR monitoring: more states are providing dynamic (through the course of the year) updates to previously purchased MVRs enabling near-real-time updates of driver scores and status. Other systems enable your team to prioritize select drivers for annual, semi-annual, quarterly, or monthly updates based on risk score. See also “Why Order MVRs“; “Deciphering MVR Profiling“; “Digging into the MVR – For Stronger Results“; “MVRs and Risk Scores“; “Do you know if your drivers are properly licensed“; “Identifying Drivers Who May Be “At-Risk” of Becoming Involved in a Collision: MVR Analysis” (Page 8)

Some fleets pick one of these monitoring/managing practices and run with it. This is certainly better than running bare and hoping for the best, but I’d submit that relying on only one strategy presents a pretty wobbly bridge that sways and flexes a lot. Adding layers builds strength and predictability in the program by covering up gaps that any one program may lack.

For instance,

  • if I were to rely on GPS alone, I wouldn’t know about red light running unless the drivers were stopped and ticketed by the police. GPS systems are not equipped to detect red light running.
  • if I were to rely on camera-in-cabin videos alone, I’d only find out about actual collisions in most cases (most systems rely on a triggering event to save the short loop of video and most drivers realize that by hitting curbs during the “break in period” the management team will adjust the sensitivity to the point where the system becomes a post-incident-event-recorder). This does not invalidate the program nor am I trying to dissuade its use, but as a “stand alone” system it may have a vulnerability.
  • if I were to rely only on driver education without other systems to alert me to actual driver habits, I’d be asking drivers to give up productive drive time to train on topics that may not be a fit to each driver’s own habits.

By combining data inputs from how’s my driving, telematics, cameras, etc. I can tailor the coaching and education to accomplish more in less time: train the right drivers on the right topics at the right time (when they really need it).

Here’s how I see the fleet that prioritizes building layers to give a solid foundation to their fleet safety program:

Banner gap filled program

The other very real advantage to drivers is that by being a benevolent “big brother” the management team has the ability to help them modify habits before incurring violations (which are typically paid out of pocket, influence personal/family insurance costs, and negatively affect future employment prospects).

Most critically, when these layers appropriately target drivers who may be “at-risk” of becoming involved in a collision, there is a greater opportunity for a “compassionate intervention” by management that could prevent a collision with it’s potential for injuries or death.

The authors who’ve published the “high level overview” of fleet safety programs are brilliant professionals with many years of experience — I don’t doubt their knowledge, ability, experience or caring; however, I wonder why we keep seeing so many of the “same” articles that go on for pages about pre-qualification and on-boarding.

If the average tenure of a driver was under a month or two, it would make sense to constantly be replacing and training drivers as your primary day-to-day safety activity, but we know that’s not reality (or shouldn’t be).

Sure there’s turnover, but what are safety managers doing in between that initial driver training class and the next accident investigation?

It seems to me that if a realistic “driver management” program were in place (as suggested by ANSI Z15 and illustrated by the multi-layer program, above), then the safety manager would spend much of his/her time working that program to PREVENT collisions, injuries and moving violations.

Summary

Drivers are bright, caring people doing a difficult job in most circumstances. Likewise, safety managers genuinely care about helping drivers be safe.  We need to be vigilant in all areas of our driver safety programs to be effective.

The missing bridge between effective driver qualification and minimized crash events is an effective driver management program!  Layering multiple data inputs and washing them through a database to deliver “tip of the iceberg” conclusions helps managers focus their time and energy on those drivers who need the most urgent attention on specific topics. As you re-evaluate your current program, look for gaps in developing key data that would be useful in helping zero-in on select drivers for meaningful coaching interventions.

Similarly, ensure that your front line supervisors are versed in conducting positive coaching sessions designed to illustrate the cooperative nature of safety teamwork — drivers and managers working together to be safe instead of playing the “blame game”.

Coaching

Learning from Crash Events

There’s a lot being reported about the crash on the New Jersey Turnpike which involved a Tractor Trailer and a chauffeured limousine-van transporting comedian Tracy Morgan. Tragically, several people were injured and one passenger died.

Some of the clear facts include:

  • The tractor trailer was traveling above the posted (construction zone) limit of 45 MPH.
  • The event occurred during the early morning hours when visibility is reduced and all drivers are more prone to drowsiness.
  • The tractor trailer operator had been on duty for most of his allotted-by-regulation time (suggesting fatigue as a possible contributing factor).

According to other reports (Star Ledger, et.al.):

  • The tractor trailer “…was equipped with sophisticated collision-avoidance systems that included forward-looking radar with interactive cruise control — all designed to begin automatically braking the big truck when it sensed traffic slowing down. It was programmed to notify the driver of any vehicles stopped ahead in the roadway. There was an on-board computer, blind spot sensors, and electronic controls limiting its top speed to 65 miles per hour.”
  • ATA executive vice president David Osiecki was quoted as saying that speeding is “the highest cause and contributing factor” in most crashes.  Further, “We want to return to a national maximum speed limit. Some states are at 80. Some at 75. That’s the biggest safety problem on the highways.”

So what can we conclude — how do we learn from this to prevent similar tragedies in the future?  The National Transportation Safety Board and the NJ State Police are actively investigating to follow up on questions like:

  • Did the on-board collision warning and avoidance system fail to function correctly?
  • While the tractor trailer driver was within his regulated allotment of duty/driving hours, should the regulations be modified further?
  • Was a lack of enforcement of speed limits in a construction zone play some role in creating a culture of speeding on that highway?
  • Were seatbelts in the limo adequate to prevent further/greater injuries or could their design be improved, too?

All road deaths and injury producing crashes are tragic, and we need to learn from each occurrence to determine ways to prevent future events.

cropped-drowsy-driving.jpg

New NHTSA Study

drowsy drivingWhen dealing with a ‘ton of data’ about crashes, causes, contributing factors, costs and such, it can take several years to fully value and understand what it all means.  Why?

  1. First, there’s a lot to analyze.  
  2. Second, not all final crash costs are known until the bulk of medical treatments have been completed and reported.  
  3. Third, data about the source data becomes available during the analysis process (we gain insights as the analysis proceeds — sometimes causing us to reverse and re-examine details).

With these points in mind, the National Highway Traffic Safety Administration (NHTSA) recently released a new study of “The Economic and Societal Impact Of Motor Vehicle Crashes” that occurred during 2010.

cropped-thanksgiving-traffic.jpg

We wanted to share some select quotes from the study to highlight several key findings.

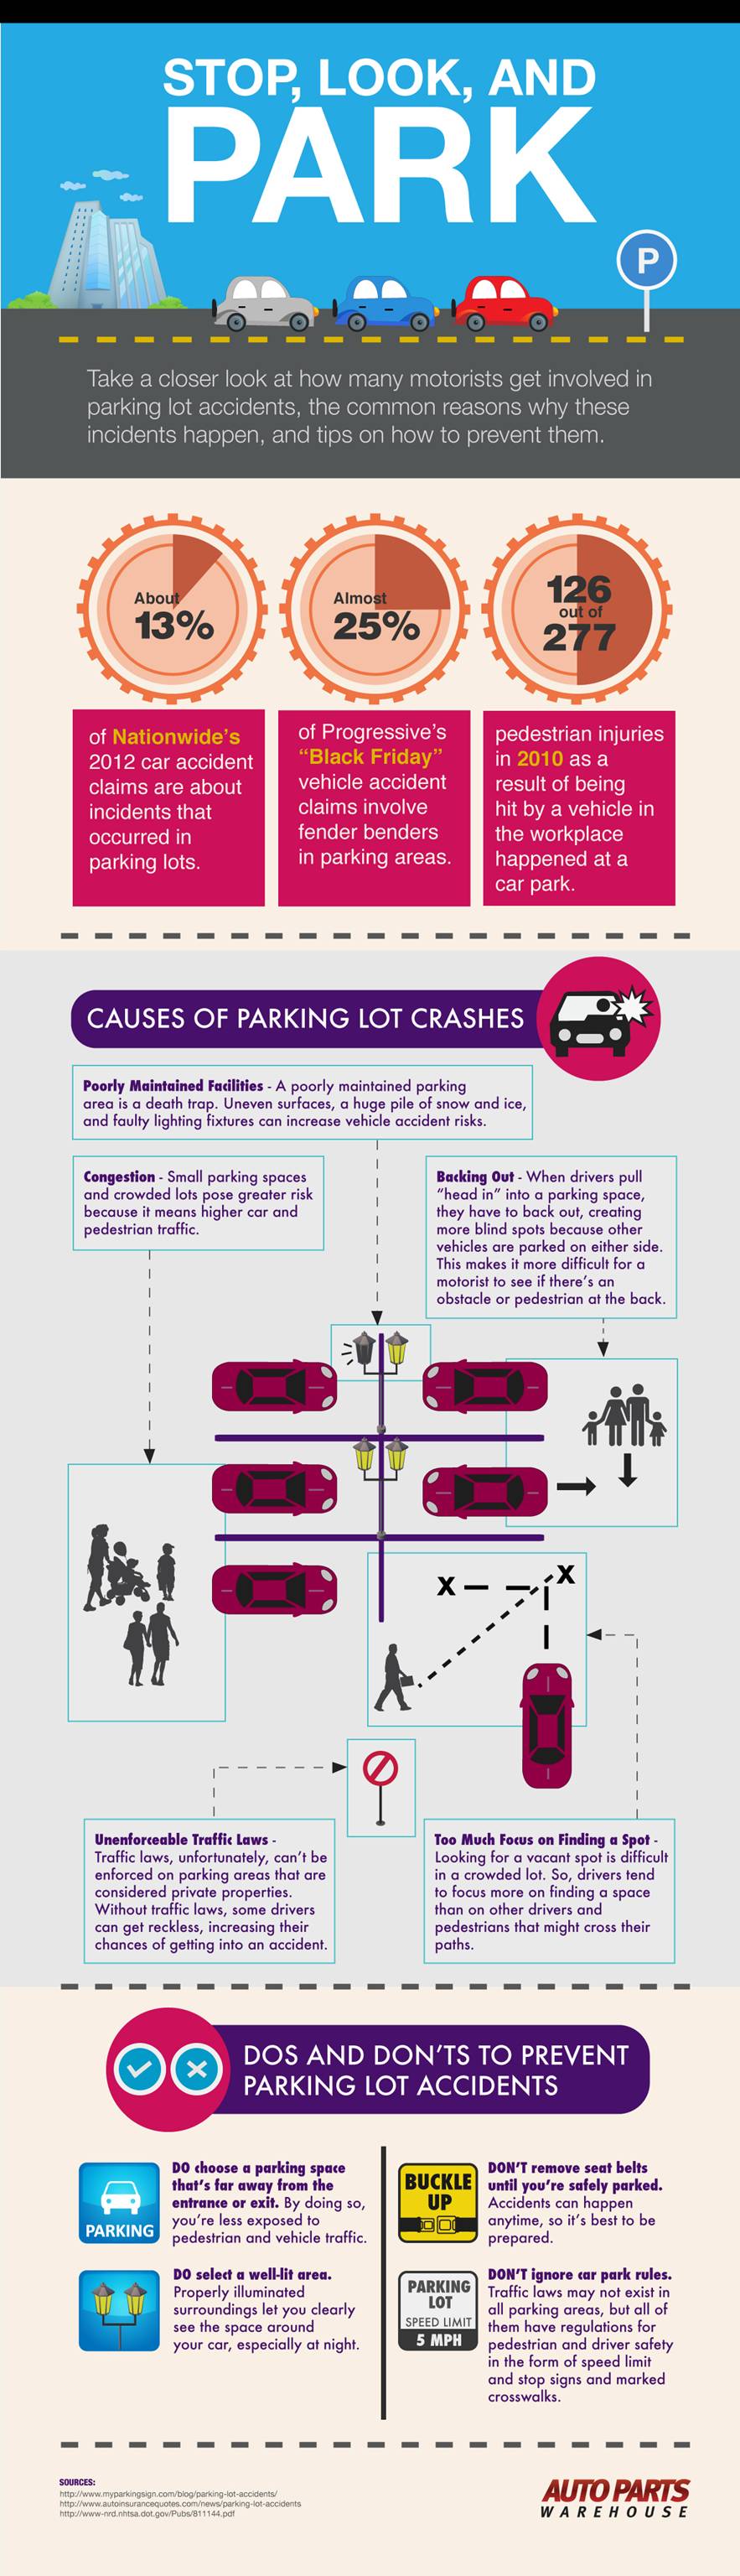
In 2010, there were 32,999 people killed, 3.9 million were injured, and 24 million vehicles were damaged in motor vehicle crashes in the United States. The economic costs of these crashes totaled $277 billion. Included in these losses are lost productivity, medical costs, legal and court costs, emergency service costs (EMS), insurance administration costs, congestion costs, property damage, and workplace losses. The $277 billion cost of motor vehicle crashes represents the equivalent of nearly $897 for each of the 308.7 million people living in the United States, and 1.9 percent of the $14.96 trillion real U.S. Gross Domestic Product for 2010. These figures include both police-reported and unreported crashes. When quality of life valuations are considered, the total value of societal harm from motor vehicle crashes in 2010 was $871 billion. Lost market and household productivity accounted for $93 billion of the total $277 billion economic costs, while property damage accounted for $76 billion. Medical expenses totaled $35 billion. Congestion caused by crashes, including travel delay, excess fuel consumption, greenhouse gases and criteria pollutants accounted for $28 billion. Each fatality resulted in an average discounted lifetime cost of $1.4 million. Public revenues paid for roughly 9 percent of all motor vehicle crash costs, costing tax payers $24 billion in 2010, the equivalent of over $200 in added taxes for every household in the United States.

Clearly, traffic crashes cost a lot of money!

Key contributing factors to the crash data in 2010 included:

  • Impaired (drunk) driving
  • Speed
  • Distraction
  • Seat belts saved many, but some (3,350 people) perished for failing to use their restraints properly/consistently

It is staggering to realize that during 2010, there were more than 3.9 million people injured in 13.6 million motor vehicle crashes (including about 33,000 fatalities).  Alcohol-involved crashes accounted for about 21 percent of all crash costs and a third of all road deaths.

Speed-related crashes (where at least one driver was exceeding the posted limit OR driving too fast for conditions) were connected to 10,536 fatalities (another third of the total for the year).

So, in hindsight, if all drivers had:

  1. worn their seatbelts properly,
  2. avoided driving while impaired and
  3. followed the speed limit (or driven with regard to local conditions)

then, about two-thirds of all road deaths could have been avoided (22,000 lives saved).

cropped-web-banner-blog-20112.jpg

The opening paragraph of the study that deals with speeding says a lot in a few words:

Excess speed can contribute to both the frequency and severity of motor vehicle crashes. At higher speeds, additional time is required to stop a vehicle and more distance is traveled before corrective maneuvers can be implemented. Speeding reduces a driver’s ability to react to emergencies created by driver inattention; by unsafe maneuvers of other vehicles; by roadway hazards; by vehicle system failures (such as tire blowouts); or by hazardous weather conditions. The fact that a vehicle was exceeding the speed limit does not necessarily mean that this was the cause of the crash, but the probability of avoiding the crash would likely be greater had the driver or drivers been traveling at slower speeds. A speed-related crash is defined as any crash in which the police indicate that one or more drivers involved was exceeding the posted speed limit, driving too fast for conditions, driving at a speed greater than reasonable or prudent, exceeding a special speed limit or zone, or racing.

In short, speeding robs you of needed reaction time – you need to make judgments faster and have less room to maneuver in an emergency.  Each of us can choose to drive slower and buy time to react and respond, but we’re often in a ‘hurry’ to get to our destination, and choose to increase or risk.

Police

The study reminded us of the urgent need for ALL drivers of cars, trucks, buses to properly use restraints such as seatbelts whenever driving.  Consider these statistics:

When properly fastened, seat belts provide significant protection to vehicle occupants involved in a crash. The simple act of buckling a seat belt can improve an occupant’s chance of surviving a potentially fatal crash by from 44 to 73 percent, depending on the type of vehicle and seating position involved. They are also highly effective against serious nonfatal injuries. Belts reduce the chance of receiving an MAIS 2-5 injury (moderate to critical) by 49 to 78 percent.

MirrorPoster_72dpiThe report did not have kind words for the use of motorcycles (however, I could speculate that the authors were concerned for the welfare of riders in delivering their findings in a stark way):

Motorcycles are the most hazardous form of motor vehicle transportation. The lack of external protection provided by vehicle structure, the lack of internal protection provided by seat belts and air bags, their speed capability, the propensity for riders to become airborne through ejection, and the relative instability inherent with riding a two-wheeled vehicle all contribute to making the motorcycle the most risky passenger vehicle. In 2010, 4,518 motorcyclists were killed and 96,000 were injured in police-reported crashes on our Nation’s roadways. This represents 14 percent of all traffic fatalities and 3 percent of all police-reported injuries. Motorcycles accounted for only 0.6 percent of all vehicle miles traveled in 2010. Per vehicle mile traveled in 2010, a motorcyclist was about 30 times more likely than a passenger car occupant to die in a motor vehicle traffic crash and 5 times more likely to be injured. The difference in these proportions reflects the more severe injury profile that results from motorcycle crashes. Over the past several decades motorcycle fatalities and injuries have generally increased relative to those in other vehicle types.

Other observations included a good reminder that intersections continue to be a prime location for crashes since there are so many ways that vehicles, pedestrians and cyclists can interact with each other during turns or even while transiting the intersection (straight across).

SUMMARY

While the data summarizes activity from 2010, we can learn a lot about behavior, choices and safety results.  There’s never an inappropriate time to share safety messages with drivers about obeying traffic laws, using seatbelts and avoiding risk taking (i.e. driving while impaired, distracted driving, etc.)

cropped-more-thanksgiving-traffic.jpg

Dynamic Duo: Healthy Pay & Respect

moneyAmong the most common search terms used to find this blog site are “incentives”; “bonus” and “rewards”.  There is, evidently, a lot of interest among fleets to tie safety performance (and tenure) to incentive or reward programs.

While we’ve offered articles on those topics in the past (“Driver Recruitment and Retention: A Winning Combination” for example, or just use our search function at this site if you’re curious about other articles), we figured it was time for another update.

Recently, Heavy Duty Trucking published an article titled “Finding and Keeping Driver With The One-Two Punch: Pay & Respect” (Click HERE to see the entire article). While their article was more concerned about recruiting and retention than safety, some of the themes and advice could apply to safety issues as well.

cropped-truck-traffic.jpg

A couple of interesting quotes from the article include:

  • Large truckload carriers have seen their turnover rate hold above 90% for eight quarters in a row, according to the latest figures from the American Trucking Associations.
  • Generally drivers cite two main broad reasons for jumping from one company to another: pay and respect. And the same factors that can keep drivers with your company can also help attract new drivers to your company – especially when you consider the importance of word-of-mouth and referrals.
  • More companies are avoiding across-the-board mileage pay increases in favor of various incentive packages, bonuses and incentives that reward the best performers.
  • Fuel economy is a major driver of these types of programs. But perhaps just as important is safety and compliance.
  • “Driver retention comes down to having quality relationships with your drivers,” says Andrew Winkler, director of operations at Nebraska-based Grand Island Express, which had a driver turnover rate in 2013 of 36%.  “Happy drivers don’t leave good carriers. Treat them with the respect they deserve…and that starts at the top. Our president insists on meeting face to face with each new driver or orientation class.”

SafetyFirst

PSP Use Affecting Crash Rates Among Regulated Fleets

LTBCS 2011The Federal Motor Carrier Safety Administration (FMCSA) released a study in October which concluded; “…carriers using PSP reduced their crash and driver OOS rates over the general carrier population.

What is PSP?  The Pre-Employment Screening Program (PSP) was launched on May 11, 2010, and is a voluntary program that enables motor carriers to obtain five years of crash data and three years of inspection data on prospective new hires.  The system is specifically designed to help determine whether a driver applicant should be hired by the carrier.

So the question has lingered since the introduction of PSP — would its use make a difference in results?

From the study:

Since the mission of FMCSA is to reduce crashes, injuries, and fatalities involving commercial motor vehicles (CMVs) and FMCSA data indicate that many crashes are due to driver error, the impacts PSP has on the safety performance of drivers and the motor carrier industry is of particular interest to the Agency.

The methodology examines crash rates and driver-related out-of-service (OOS) rates of the portion of the motor carrier population using PSP. Safety performance of these carriers is compared for a 12-month period prior to and 12 months after the start of using PSP. These data are then compared to a control group of motor carriers that did not use PSP.

FMCSA’s analysis determined that both the PSP group and the control group (non-PSP) experienced a decline in crashes in all size classes. However, the motor carriers using PSP witnessed a greater decline in crash rates over the non-PSP group in the four size classes. After adjusting the crash rate improvement of the PSP group by removing the control group effects, the PSP group still showed improvement in all four size classes (although statistical significance was shown in only two size classes). The overall adjusted improvement in the crash rates for the PSP group, across all size classes, was statistically significant (see Table 1). The PSP group also experienced a decrease in driver OOS rates in all size classes. When adjusted for control group effects, this improvement in driver OOS rates was still statistically significant in all size classes.

So the answer is, YES, carriers using PSP seem to have done a better job in qualifying and selecting candidates that perform better on the job.  Interestingly the use of PSP is steadily increasing, too.  “Currently, there are about 35,000 PSP users making about 70,000 requests per month.”

Accident Analysis

As reported in an article (click here) at truckinginfo.com, the specific results were impressive:

“The overall adjusted improvement in the crash rates for the PSP group, across all size classes, was statistically significant,” said the report.

Another example of a blended scoreIt also found those using PSP experienced a drop in driver out-of-service violations.

Overall it found crash rates declined 8% for carriers while driver OOS violations fell 17.2% for fleets using PSP, as opposed to those who haven’t

Declines in crash rates were even bigger for carriers who have between 6 and 20 drivers, falling 20.6%, and those with between 21-100 drivers, declining 21.1%.

FMCSA says the 12.4% decline in the crash rates with trucking operations that have 1 and 5 drivers, and a drop of 3.4%, for those with more than 100, are not statistically significant.

Declines in the driver OOS rates for carriers using PSP as opposed to those not using it, ranged between 10.1% for those with 21 to 100 drivers, to as much as 18.3% for those with between 1 and 5 drivers.

Most carriers use the system to verify or validate that the candidate accurately reports information about past OOS and crash data on their applications.  Some even use the data to help validate prior employer information and such.  Again, from the report:

  • The motor carriers that responded obtained a PSP report on every driver they
    hired. The most frequent use of the report, as described by the carriers FMCSA queried, is to assure that drivers are accurately reporting all information on their applications, and not omitting places of employment or crashes.
  • Violations in the PSP report for pre-trip inspections, logbooks, and speeding were high on the list of concerns and were generally believed to be a better indication of a driver’s safety performance rather than violations that the driver had little direct influence to avoid.
  • Motor carriers responded that they can also observe if drivers have worked for companies with poor safety ratings in the past.

smc 1All in all, the combination of screening and selection methods available to motor carriers seems to be enhanced greatly when using PSP consistently.  The combination of MVR, previous employer checks and PSP data can be insightful — SafetyFirst is able to provide PSP data and MVRs from all 50 states.  Let us know if you’d like more information on our driver risk profiling services, online training or GPS platforms.

The FMCSA report concludes with this observation:

“Anecdotally, companies that use PSP think the program has value, they use PSP for all of their hires, and they plan to continue using PSP. These companies tend to believe drivers with favorable PSP data are more in demand and, potentially, more marketable and valuable.”

A slide show summarizing the report is available by CLICKING HERE.

cropped-truck-traffic.jpg

Traffic Fatalities Increased In 2012

NHTSA 2012 OverviewWhile it’s tragic that deaths increased in 2012, we are glad that highway deaths over the past five years are at historic lows.  What’s strange was the sudden and unexpected rise in crash activity during the first two quarters of 2012 (the first quarter jump in activity was the largest spike in recorded NHTSA history.)

So here’s the latest from NHTSA:

  • …highway deaths increased to 33,561 in 2012, which is 1,082 more fatalities than in 2011. The majority of the increase in deaths, 72 percent, occurred in the first quarter of the year.
  • While Americans drove approximately the same amount of miles in 2012 as in the previous year, the new FARS data released today showed a 3.3 percent increase in fatalities from the previous year.
  • Fatalities in 2011 were at the lowest level since 1949 and even with this slight increase in 2012, we are still at the same level of fatalities as 1950. Early estimates on crash fatalities for the first half of 2013 indicate a decrease in deaths compared to the same timeframe in 2012.
  • Fatalities among pedestrians increased for the third consecutive year (6.4 percent increase over 2011). The data showed the large majority of pedestrian deaths occurred in urban areas, at non-intersections, at night and many involved alcohol.
  • Motorcycle rider fatalities increased for the third consecutive year (7.1 percent increase over 2011). Ten times as many riders died not wearing a helmet in states without a universal helmet law than in states with such laws.
  • Large-truck occupant fatalities increased for the third consecutive year (8.9 percent over 2011).
  • Deaths in crashes involving drunk drivers increased 4.6 percent in 2012, taking 10,322 lives compared to 9,865 in 2011. The majority of those crashes involved drivers with a blood alcohol concentration (BAC) of .15 or higher – nearly double the legal limit.
  • The number of people killed in distraction-affected crashes decreased slightly from 3,360 in 2011 to 3,328, while an estimated 421,000 people were injured, a 9 percent increase from the estimated 387,000 people injured in 2011. NHTSA is just beginning to identify distraction-related accidents, and is continuing work to improve the way it captures data to better quantify and identify potential trends in this area.
  • Nighttime seat belt use continues to be a challenge. In nighttime crashes in 2012, almost two-thirds of the people that died were unrestrained.

cropped-drowsy-driving.jpg

NHTSA has prepared a summary of the 2012 data as a PDF which can be found HERE

Additionally, NHTSA has a preliminary look at 2013 available HERE

So if your fleet has seen an uptick in fender benders, consider a review of the many free articles offered at this blog site.  Further, if you need more specific help, call on us.

NEw logo

Benchmarking Violation Data

Atri 2011 coverIn 2005 and 2011, ATRI provided a ground-breaking study of the connection between violations and increased crash risk (Click Here).

Having studied more than a half-million driver records, the analysis was incontrovertible and carries powerful implications for driver safety supervisors, managers and directors.

In short, when a driver receives a violation, the likelihood of a crash also goes up by a specific factor.  

We’ve also seen a connection between tighter MVR profiles and decreased crash numbers:

“As recently reported at a fleet safety conference, two similar fleets had chosen to use the same standard for MVR review — exclude violations greater than 36 months old and allow for a combination of three violations and one preventable crash before suspending driving privileges.  One of these fleets tightened their standard to two violations and one crash during the most recent 24 months and saw a five point reduction in collisions (from 22% of their fleet vehicles involved in a crash per year to 17% of their vehicles involved in a crash) and $2 million in savings.”  (click here for full coverage)

Now our question to progressive fleet teams is this — are you benchmarking your driver profile results against national trends in violations to assess relative crash risk?

Violatios Table

Consider this table (above) and how your individual drivers stack up against national averages.  IF your drivers have a greater share of violations than the average, what would you do to step up your performance monitoring or refresher coaching?

  • Could this data be used against you in a Negligent Supervision lawsuit?
  • Is your defense going to be proactive and demonstrate that you actively monitor this data and assign coaching, education, monitoring resources or to claim “we didn’t know“? (not knowing is never a realistic defense)

If you’re using an automated MVR solution to pull in MVR data and profile it, you should be considering:

  1. whether the ACD code tables are up to date (many providers haven’t updated their code lists in years and can’t even post a texting violation properly!)
  2. whether your data can be exported to spreadsheet for analysis against national records like the table presented above, or whether your provider can automatically provide a comparison on a “driver-by-driver basis” against such public data
  3. whether your MVR profiling efforts should include other proactive, leading indicators of performance such as GPS alerts, how’s my driving alerts, or even camera in cabin video analysis.
  4. how you compare actual MVR results to your own loss data to validate the ATRI study and take action on “at-risk” drivers to reduce collisions
  5. how to link your MVR (ACD Codes) to refresher training modules to document immediate action taken on all drivers (who show a change in results) each time their MVR is obtained.

Of course, it may be easier to simply use our plug-n-play E-DriverFile system, Safety Hotline Program and “SafetyZone” LMS to handle these issues for you.  We work with the nation’s largest fleets (of CMVs and non-regulated vehicles, too!) to help manage risk, safety and results.  We also maintain an “in-network” system of relationships with more than 75 insurance providers who use our services with their select, targeted clients.

Copy of Copy of EDF LOGO (final)

Profiling Driver Event History

All motor fleet operations generate or collect various data on their driver’s performance:

  • Violations/Tickets
  • How’s My Driving Alerts
  • Crashes (at-fault, preventable, etc.)
  • Telematics (GPS, EOBR)
  • Driver Logs
  • Toll Receipts (EZ Pass, etc.)
  • Automated enforcement violations (which come direct, not through MVR data)

Additionally, fleets track information about other types of driver “events”:

  • Completion of training classes (online, classroom, tailgate talks, etc.)
  • Completion of year or years with no crashes (ie. Awards)
  • Internal Company Violations
  • Customer Complaints
  • Supervisory Observation Reports

Historically, each of these data sources have been in their own “silo” or “compartment” — but what if we could get all of this data together in one spot?  We could:

  • Another example of a blended scoresegment all drivers by relative risk taking behaviors
  • segment all drivers by crash risk
  • segment all drivers by age, tenure, training completed and then compare their crash histories to build a profile
  • determine which factors precede a collision (i.e. how many incidents, which types of incidents, etc.)
  • assign a predictability score to each driver based on actual data trends and schedule them for additional coaching or training to modify their habits and risk taking.

More simply put, we’re trying to leverage data to build awareness and reduce crash likelihood.

Fantasy?  Millions of dollars needed?  Nope. It’s real, and it’s happening right now among some of the nations largest fleet operators.

Imagine searching through 6500 driver records to find the “at-risk” needles in the haystack. Now imagine doing that with the push of one button.

One of several SafetyFirst clients implemented our E-DriverFile system three years ago on a pilot basis, but then rolled it out to their entire corporation.  This enabled them to cut the number of “at-risk” drivers in half within the first year simply by targeting their current training and supervisory resources on those people at greatest risk of becoming involved in a collision?

Pyramid 2011 for blog

Further, our new, online safety training modules are laser cut to fit specific issues surfaced by our How’s My Driving Hotline and our E-DriverFile profiling system.  These modules zero in on those risk taking habits, and remind drivers that there are serious consequences to the choices they make when behind the wheel.

At five to seven minutes each, they represent the next generation of online learning — focused, sharp, brief, emotive and able to convince drivers to “internalize” the need and desire to driver more safely — to make wiser choices — to take fewer risks.

cropped-thanksgiving-traffic.jpg

To learn more, call us toll free at 1-888-603-6987

Copy of Copy of EDF LOGO (final)